


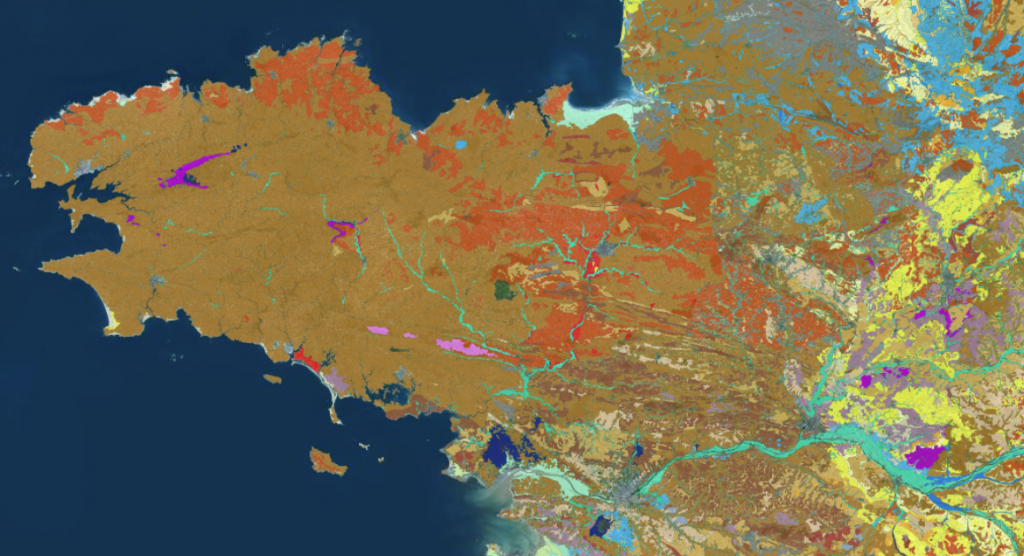
At Inicio we built Eywa, an algorithm that can find the best solar power plant location, using billions of geographical data points. Sometimes, it can be hard to make sense of all this data: forests, wet areas, cadastral parcels, etc.
To help our teams get a sense of what this data actually *looks* like, we set up a tool to allow visualization in multiple clients. It’s a server that builds maps, it is built on a library called MapServer.
Now, we use this server everywhere: from QA to visualize that our algorithm does what it’s supposed to, with the right data, to the business development teams who use it to select from the best location that the algorithm has found.
This blog post will guide you through the things I wish I had known when I started setting up this piece of software at Inicio.
Why do you need a MapServer?
- Visualize: Geographical data is inherently visual. We all have some affinity with reading maps and visualizing data in space. You can do as many transformations as you want on your spatial data, it will be hard to extract useful insights if you can never visualize it.
Showcase: Publish and showcase your insights to the world. - Showcase: Publish and showcase your insights to the world.
- Share: Integrate your data to many GIS tools and web map visualizations. You have created an awesome data visualization and want to share it to the world?
It can be enough to setup an interactive map visualization on your website. - Build: Create a robust and always-up source to fit your business needs.
What does it do?
A mapping server connect to various geographical data sources. It can perform transformations, filtering, combinations, and styling. Then, it makes the data available through a server.
This may sound relatively simple, but geographical data is challenging. You need to take care of projections, indexing, and serving very complex geometries efficiently.


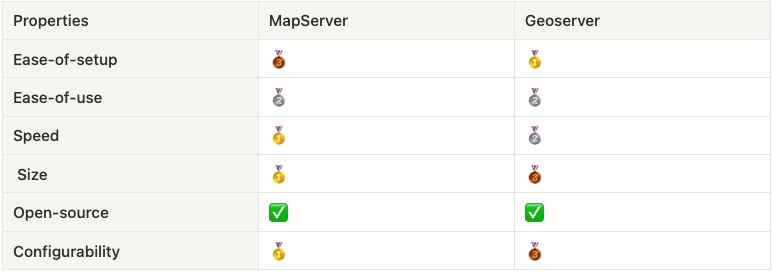
Why MapServer vs. Geoserver
In the world of mapping servers there are two main alternatives: MapServer and Geoserver.
At Inicio, we quickly realized we would need an extensible, flexible and fast mapping server to serve our large and ever growing amount of geographical data that we both ingest and produce.
- MapServer is fast: it is built in C and makes heavy use of both the most established and fastest libraries for geometrical data manipulation: GDAL and PROJ.
- MapServer is lightweight
- MapServer is configurable and scriptable
- MapServer is open-source, and has been actively maintained by a large community for almost 30 years, and funded by large organizations such as NASA! (And when I say actively, I mean it: the latest release to date is from April 2023)
Anatomy of a Mapserver
The components of a MapServer are:
What is a mapfile exactly?
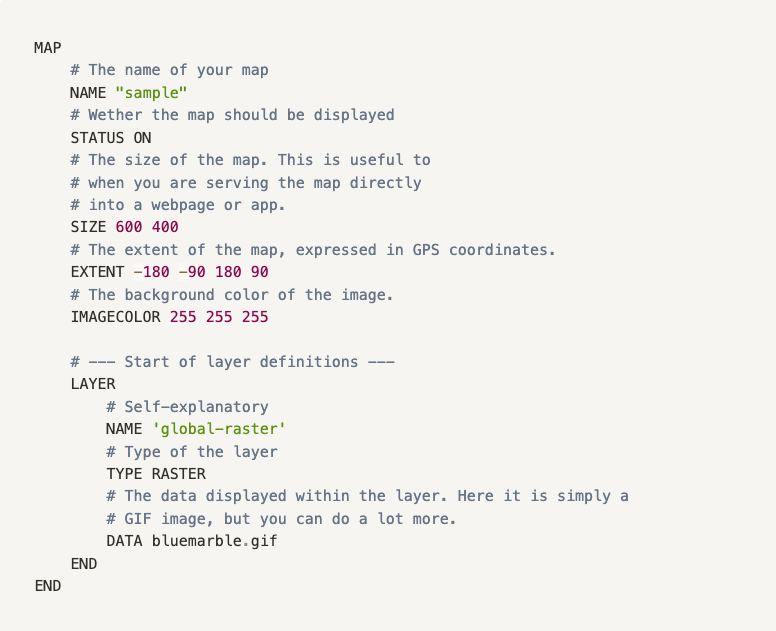
A mapfile is simply a config file written in MapServer’s configuration language. It defines everything the server needs to know to draw your map. Objects are defined with an opening tag, and .
Here is a minimal example of a mapfile. The indents are optional, but useful to keep the whole structure clear.
Here’s an example file with comments:
Choosing to make a custom config language for the MapServer configuration files is an surprising choice.
It probably made sense when this library was created, but it doesn’t seem to add any advantage over something like JSON or TOML, which are well supported nowadays and come with a lot of tooling.
At Inicio, we actually use Pydantic models that mirror the structure of these config files, and serialized them to the mapfile format! This allows us to generate and manipulate these config files as Python object, without worrying about the uncommon syntax. “Configuration-as-code”
What kind of data sources can I use?
You can serve a lot of different type of geographical data from MapServer. These data sources are the backbone of your server.
Data can be read from a file in one of the many supported formats (e.g. Shapefile, GML, GeoJSON, KML, and many more).
Another option that we use a lot at Inicio is the ability to read data directly from a database. We run a Postgis-enabled database to store most of our geographical data, and our MapServer directly fetches what it needs from it.
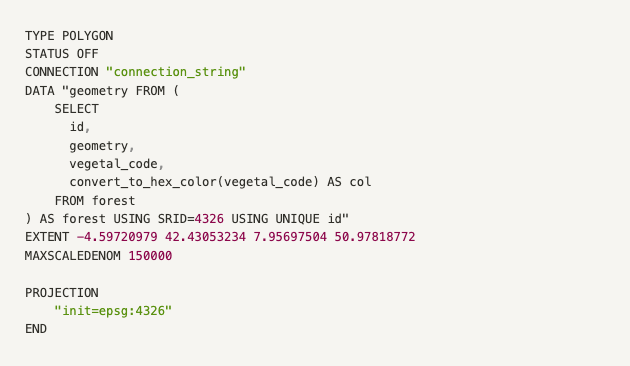
Running a query against a database in a mapfile looks something like this:
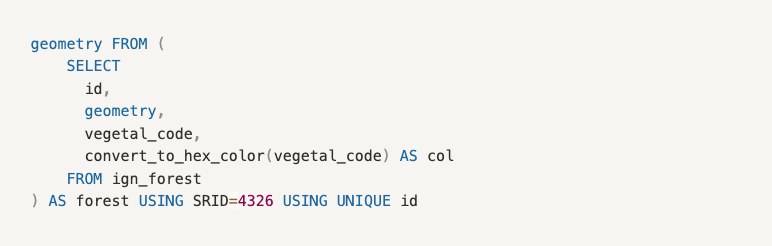
The required fields are one unique `id` and a `geometry` (or postigs `geography`). Here we export extra fields that will be used to display information within the layer, such as coloring the area depending on the type of vegetal.
‘When serving a lot of data, using spatial indexes is crucial, and the server knows how to take advantage of them when displaying data within a bounding box.
What is a layer? How can I make one?
Layers are the underlying structure of the data you will make available with the server.
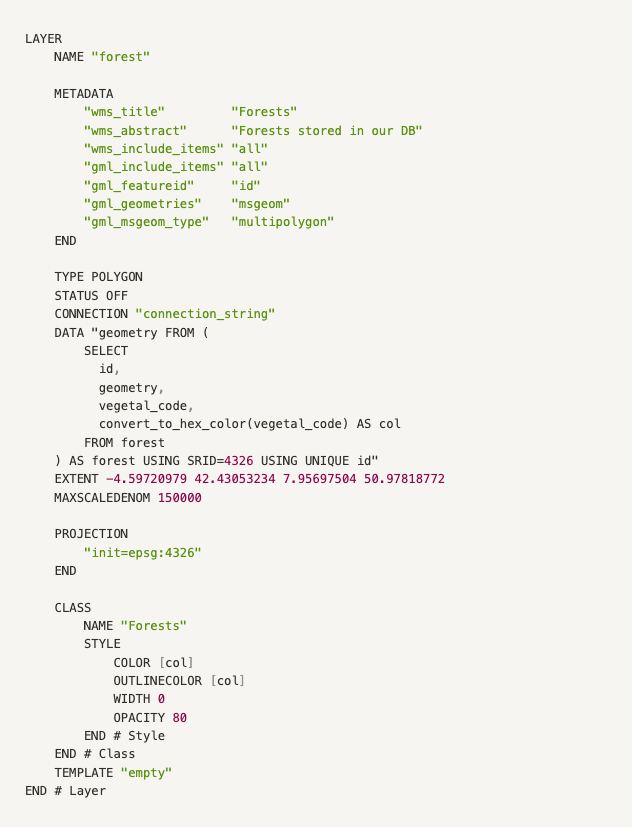
The layer below is an example of serving forest data directly from the database to a WMS endpoint.
At Inicio, we use standard protocols for serving our data, such as WMS. It is supported by most GIS software and libraries, and allows serving a lot of data efficiently.
What is WMS?
The Web Map Service is a standard for serving geographical data. It is based on XML, and usually serves data in the form of images (PNG, JPEG, etc.).
This format makes it simple to display complex spatial data in a visual way. It can serve vector and raster data within a bounding box by rendering said data to an image and sending it back.
Let’s go step by step, decoding the layer definition above:
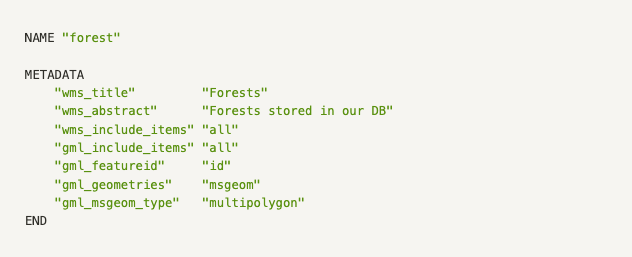
What metadata should I add for a WMS server layer?
The first part contains a bunch of metadata for your layer. There are a some required metadata for serving data through WMS such as `« wms_include_items »` which specifies if all the input data should be included in the layer.
Definition
This part defines the source of the data, how to access it, if it should be displayed, the extent it covers and the projection it should be available in.
How do you specifiy the style?
The last part is about styling the layer. This means defining the color, width opacity and all the other details of the layer’s object.
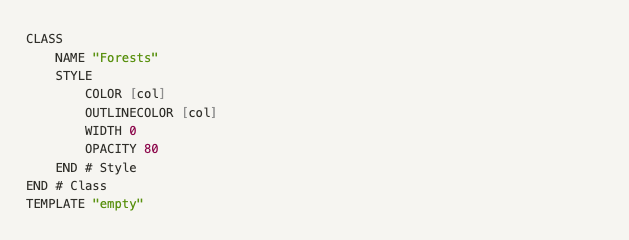
The neat part here is that the color can be returned as part of the SQL query.
How can I run it? With a CGI-capable server
We now talk about the front-side of our server.
This is maybe another marker of MapServer’s respectable age, but the recommended way of running it is through a CGI-capable server, which usually means an Apache HTTP server (which is getting close to 30 years old!).

This is a battle tested server software, that is currently running incredibly many servers in small and large structures. It is also super customizable, making it an overall reliable and powerful software. However, this comes at the cost of simplicity, and it is easy to get lost in the customization options which basically let you do anything (including dangerous stuff ☠️).
For our production server, we chose to get an Apache server running with a good config inside a well protected part of our infra. Then, another front-facing reverse-proxy handles all the heavy-lifting of HTTPS, authentication, serving other services as well as some static files.
Where to go next?
- Once you have a MapServer serving WMS up and running, and you are getting some usage, you might want to consider caching the tiles served to make access quicker (at the cost of storage and complexity). At Inicio, we use mapproxy to cache our WMS tiles. MapCache, from the same developers as MapServer, could also be worth a try.
- Scripting the creation of layers. Once you start serving several data sources, writing Mapfiles may start to feel repetitive, and it gets very tempting to script their generation. You could cook up your own solution like we did, or use an external library such as MapScript.
- There are a lot of potential optimizations and tuning to be done on a MapServer, depending on your use case. The MapServer doc has some great tips to get you started.